

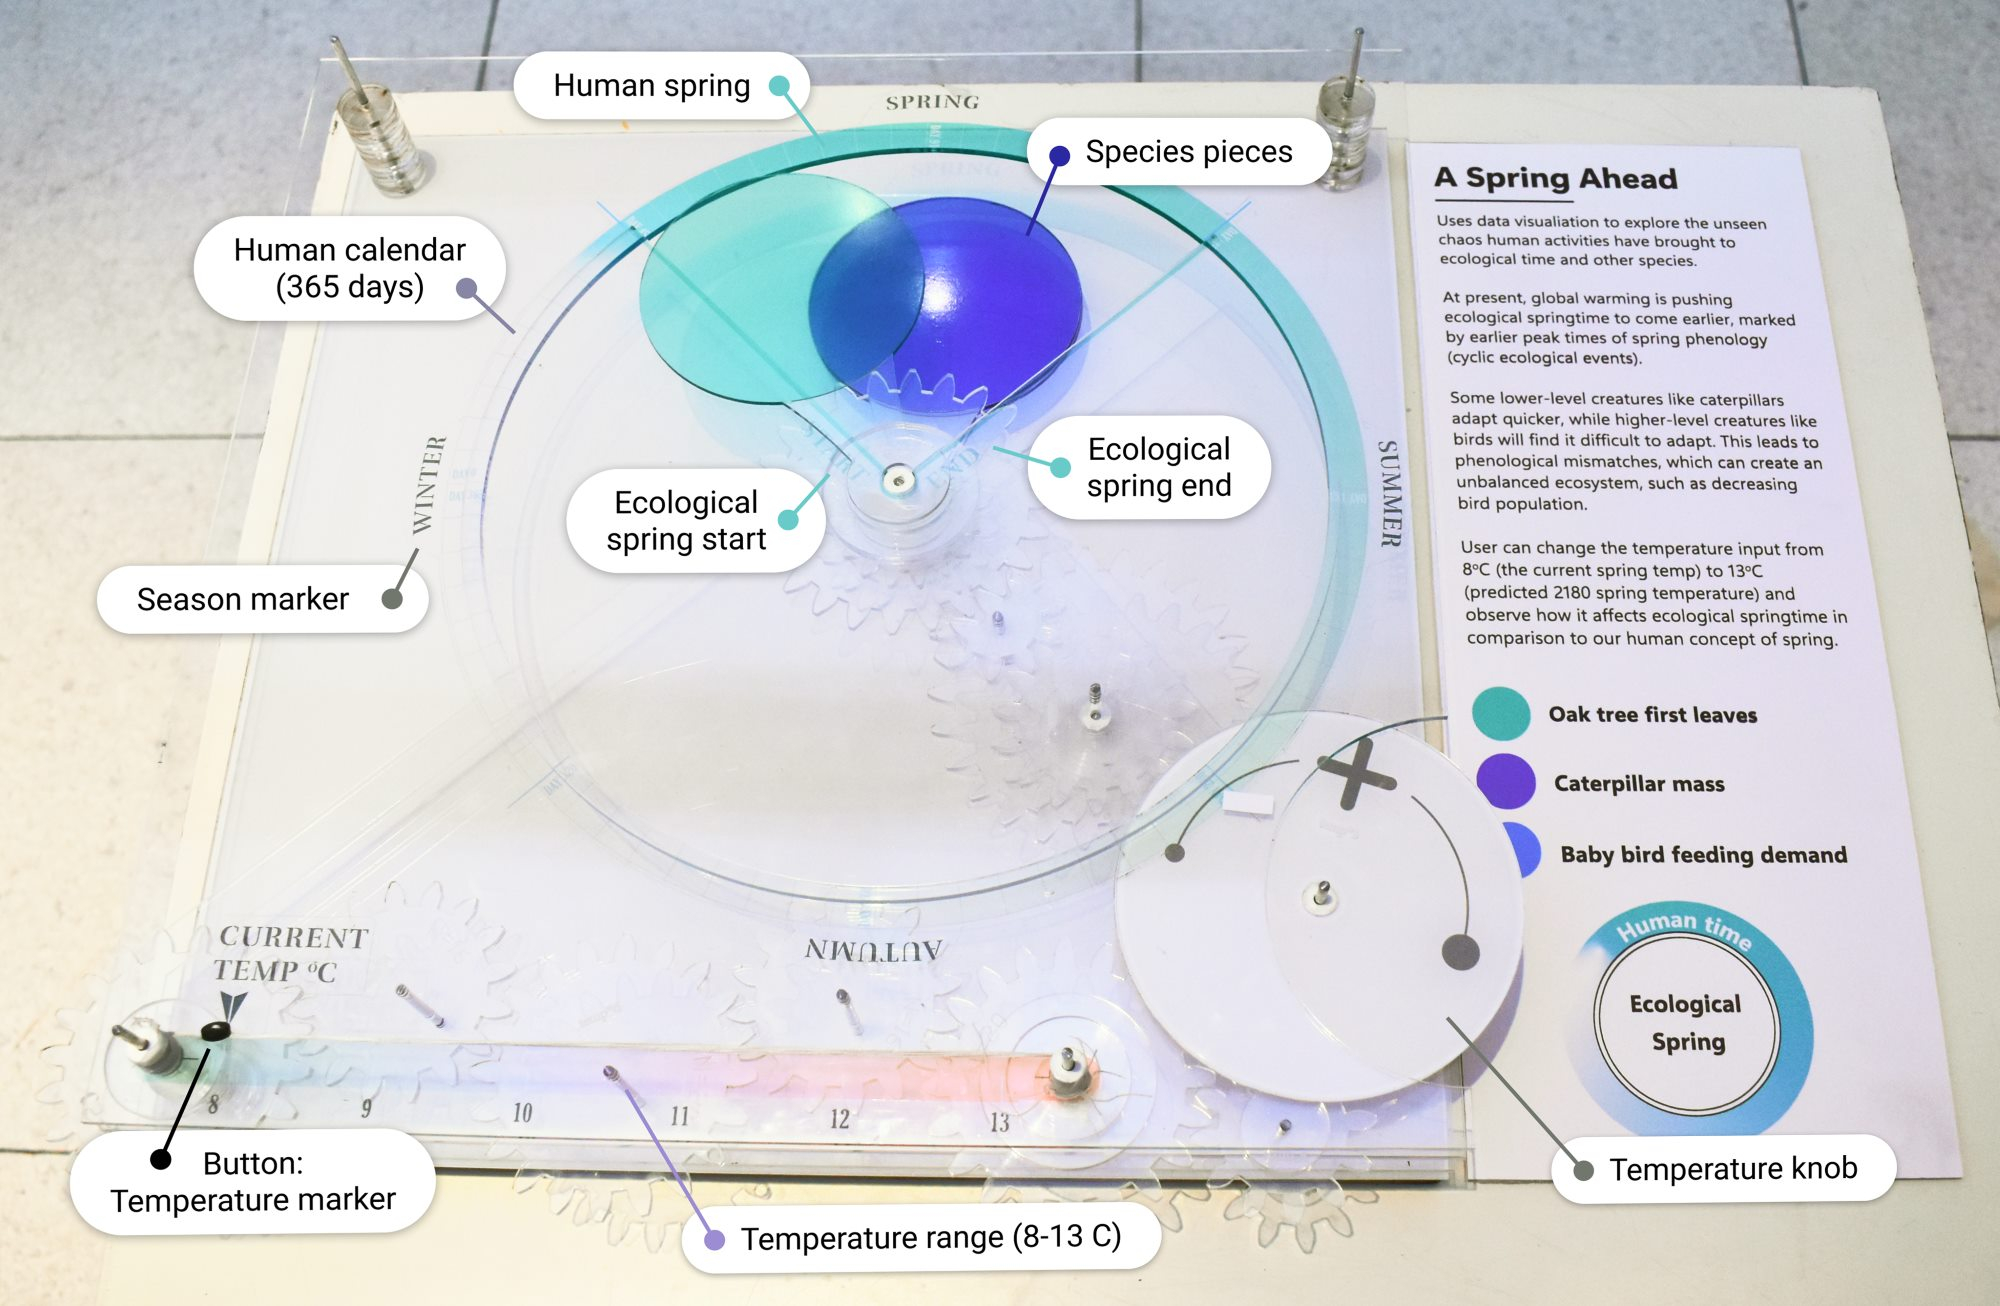
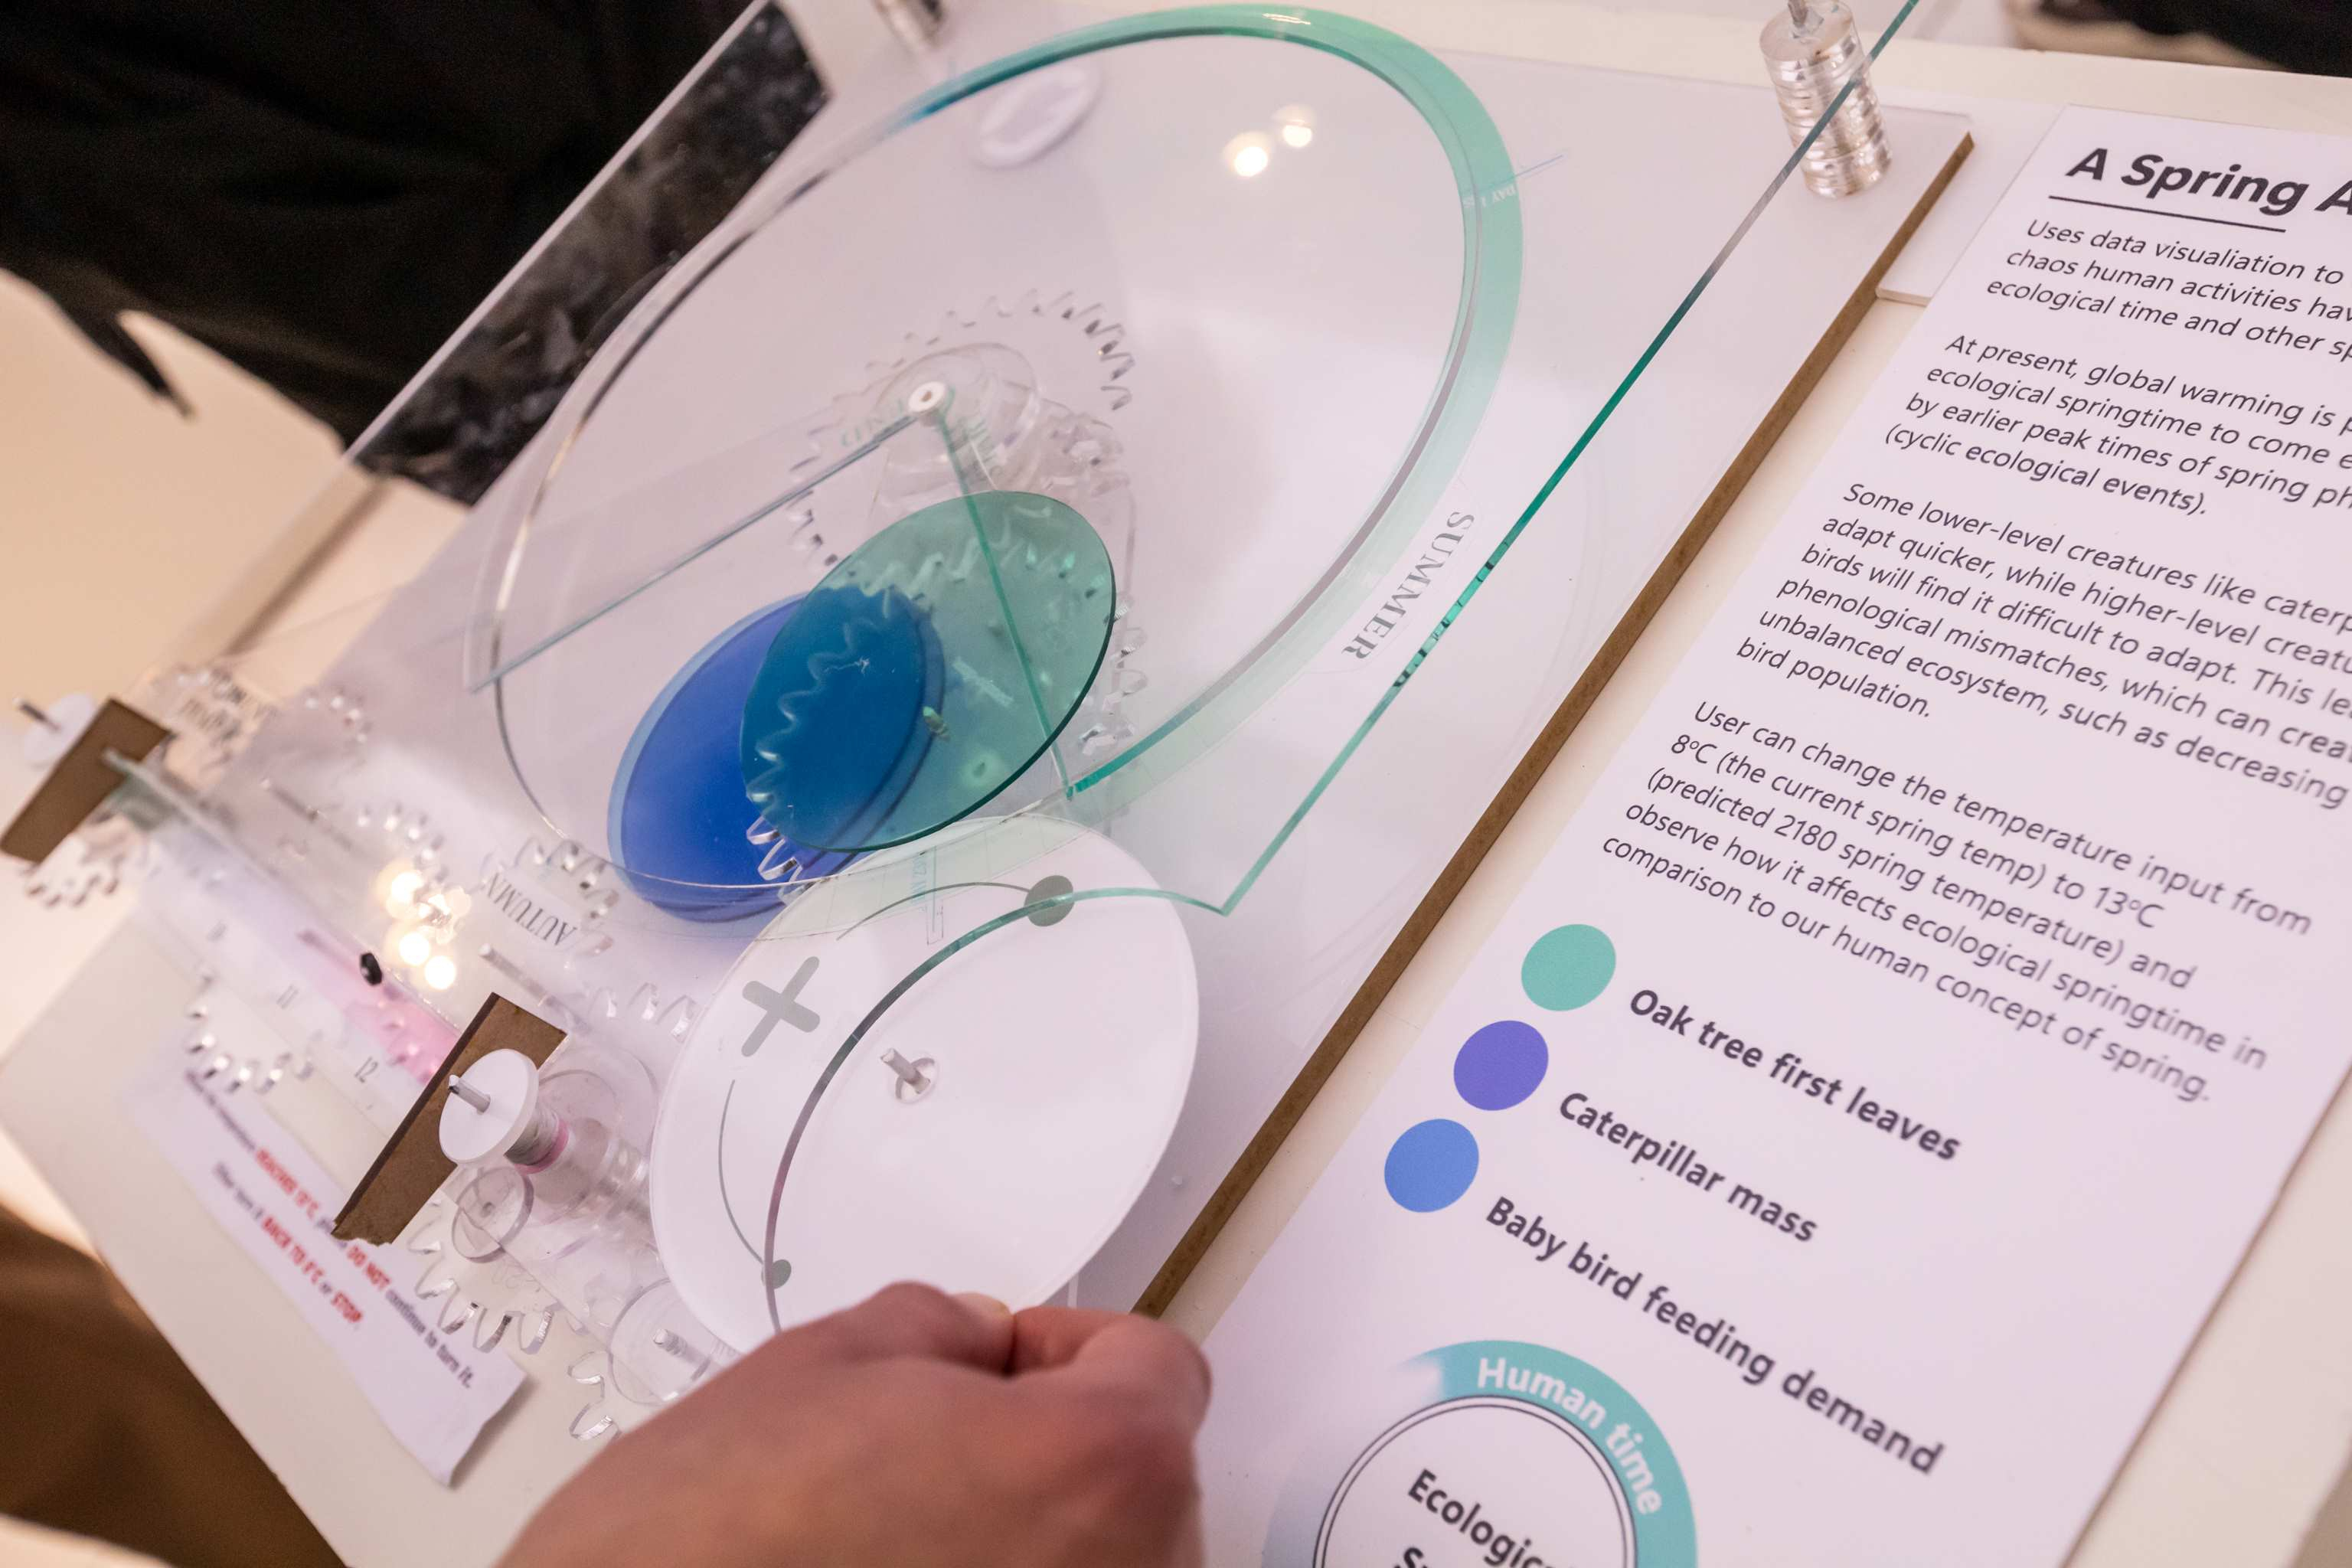
"A Spring Ahead" simulates how rising temperatures affect UK’s spring tritrophic phenologies based on data from Nature’s Calendar, Met Office, and research by Burgess et al. (2018). Each phenology is portrayed as small acrylic pieces. Overlapping pieces depict matching phenologies. Over the pieces, lies a transparent disc with a quarter gap that shows ecological spring duration. Surrounding the pieces is a fixed, circular 365- day calendar meant to show the rigidity of our concept of time.


Jenny Long
A Spring Ahead
Follow:


Project description
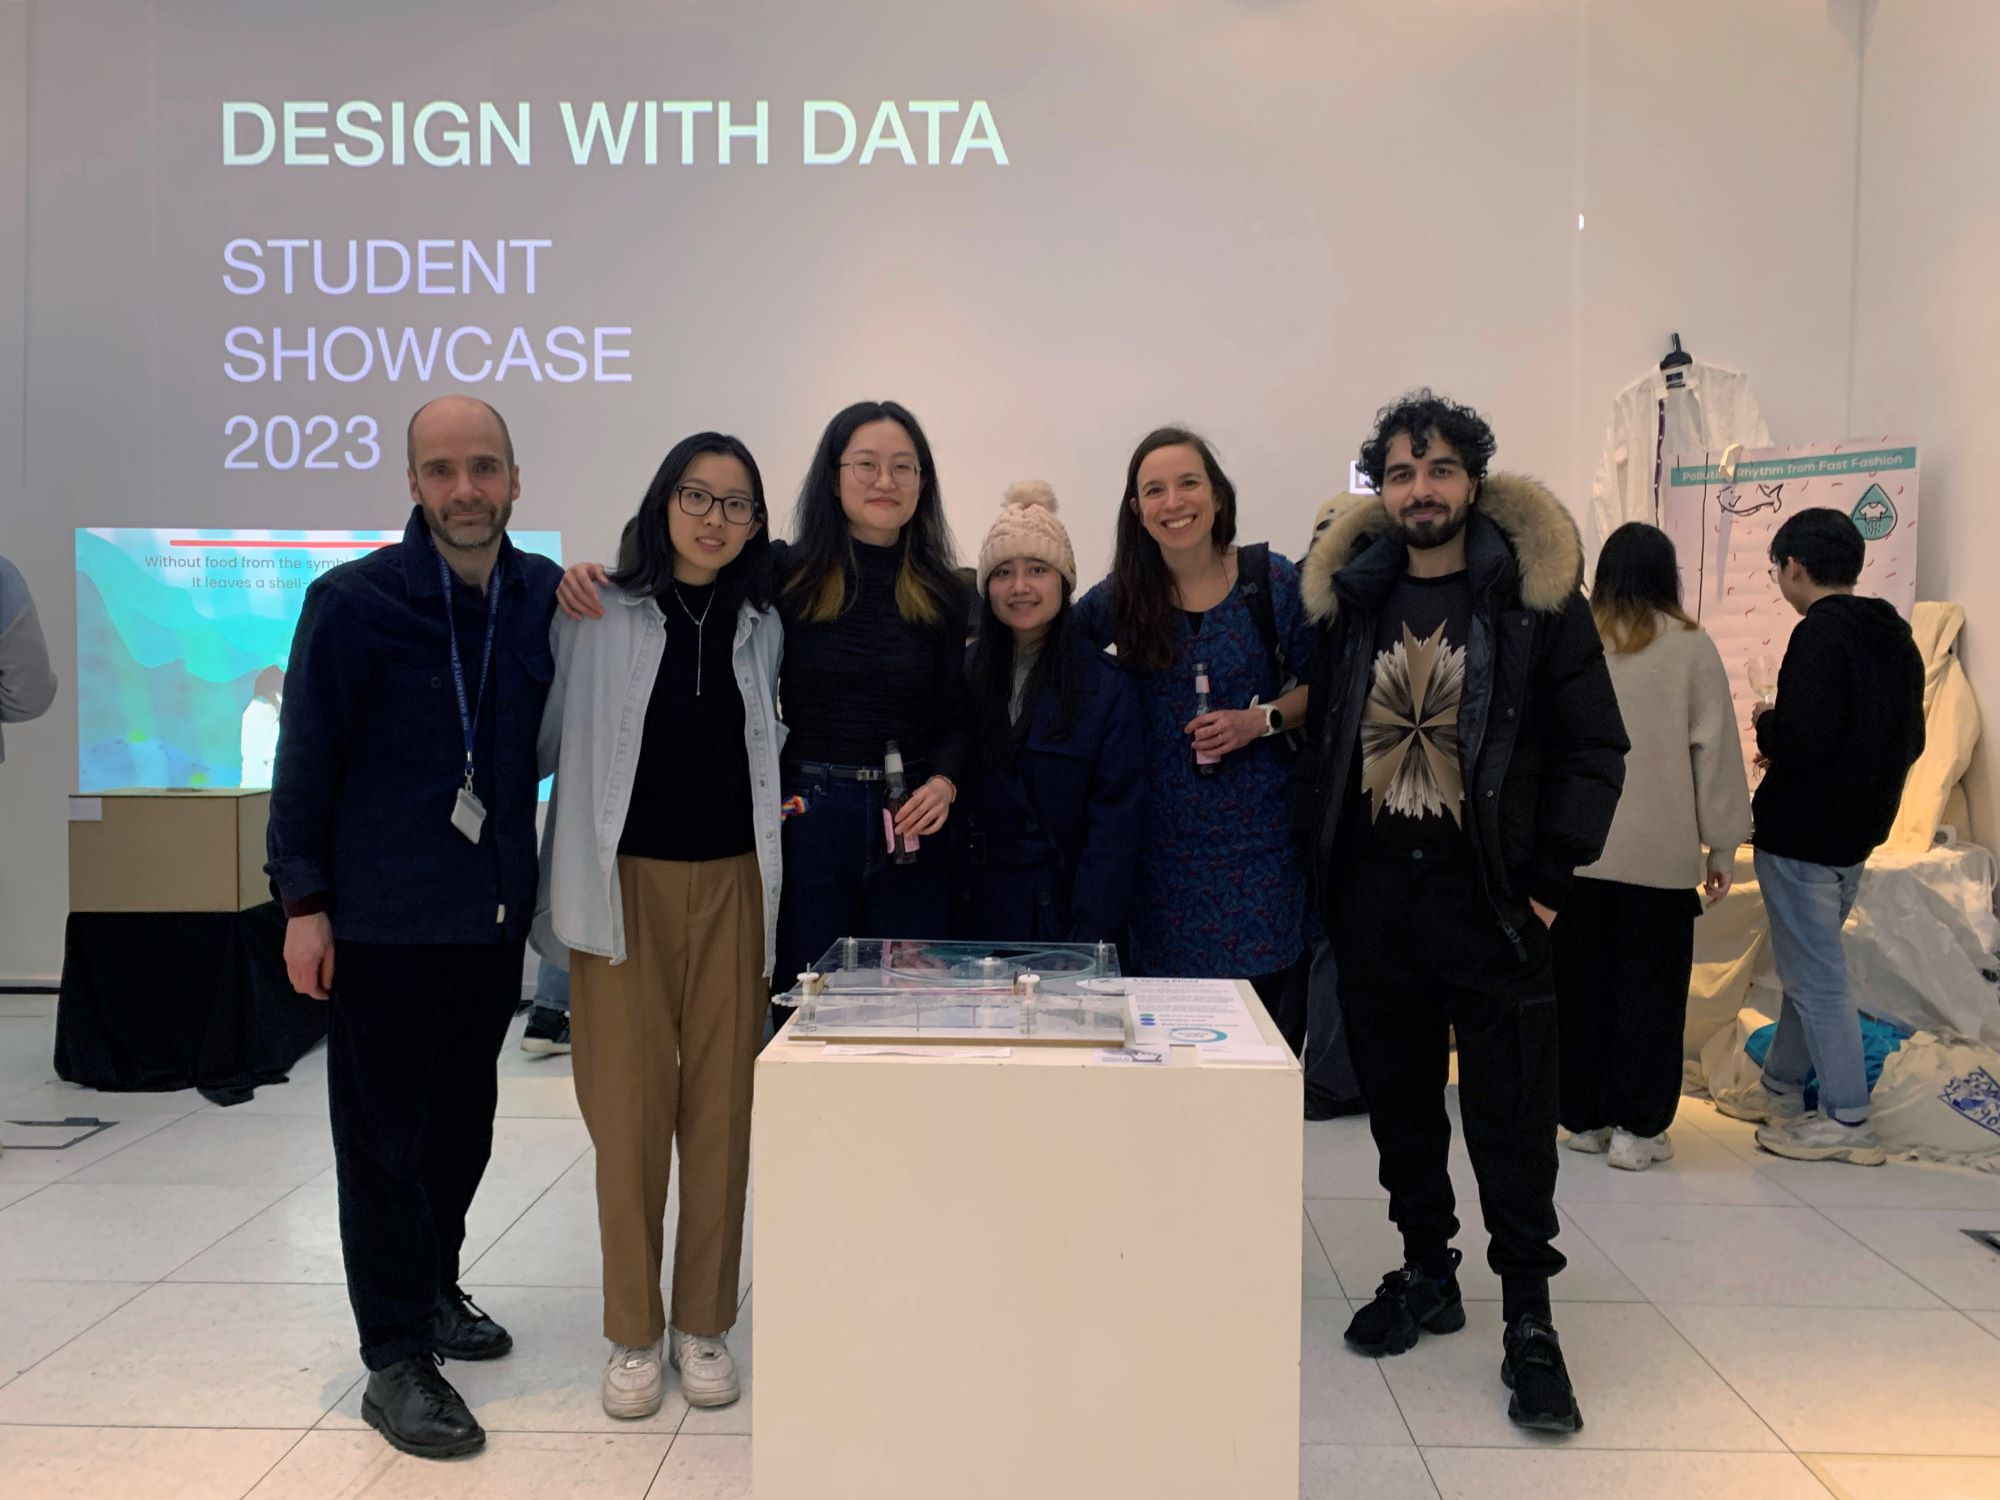
Project team
A Spring Ahead details


A Spring Ahead
Climate change has been made worse by human actions, which have led to an earlier ecological spring and thrown off the balance of how species interact with each other. One example is the relationship between the first leaf on a tree, the peak population of caterpillars, and the peak demand for food from birds. "Phenology" is the study of how these things happen in cycles.
Skills & Experience
- Digital Research Ambassador

Jenny Long
A Spring Ahead
Follow:
Share: